From soundings to strategy: How GISGRO helps ports plan, measure, and prove dredging outcomes
From soundings to strategy
How GISGRO helps ports plan, measure, and prove dredging outcomes
In this article, you will get an overview of GISGRO’s bathymetric tools for dredging, a real-life example from a port, and practical video guides on how to use these tools.
Dredging is one of those port activities that rarely makes headlines until it suddenly becomes the only thing anyone wants to talk about.
When depths start creeping up, vessels lose under-keel clearance, berth windows tighten, and safety margins shrink. In the best-case scenario, ships load less cargo or arrive with stricter tidal constraints. In the worst case, operations slow down, incidents become more likely, and reputational and financial risks rise quickly in addition to risking regulatory non-compliance.
And yet dredging is also one of the most expensive and operationally disruptive interventions a port can undertake.
Whether a port dredges regularly (as part of a yearly or seasonal maintenance cycle) or only once a decade (as a major capital project), the decisions around dredging always come back to the same core question:
What is the seabed doing, where is it changing, and what do we need to do about it?
The challenge is that while survey technology, especially MBES (Multibeam Echosounder), has become highly capable, many ports still struggle to turn survey datasets into consistent, decision-ready insight. The data exists, but too often it remains underused: locked in project folders, spread across systems, or interpreted differently from one team or contractor to the next.
That’s exactly where GISGRO’s dredging and volume analysis tools come in: helping ports move from “we have surveys” to “we have answers”.
Dredging isn’t just a cost, it’s a necessity
Ports dredge for different reasons, and those reasons shape the questions they need to answer.
Maintenance dredging
Ongoing, periodic dredging to maintain declared depths and keep channels, basins, and berths safe and operable. Here, ports need to understand
- Where shoaling is occurring
- How quickly it’s progressing
- Whether patterns are seasonal, storm-driven, or structural
- How much material must be removed to restore service levels
Capital dredging
Large-scale deepening or widening to enable new vessel classes, increase capacity, or support redevelopment. Now, the focus is often elsewhere.
- How much material is actually in the design prism?
- Are we seeing unexpected overbreak or undercut?
- What changed between pre-works and post-works?
- How do we document compliance to spec and contract?
In both cases, accuracy matters. But equally important is speed, consistency, and clarity because dredging decisions are rarely made in a vacuum. They involve marine operations, engineering, finance, planning, environmental teams, contractors, and external stakeholders.
To make good decisions, everyone needs to be looking at the same truth.
A practical toolkit for turning MBES into action
GISGRO provides a set of analysis tools designed specifically to help ports interpret bathymetry, quantify requirements, and communicate results clearly. Below is a breakdown of the core tools and how ports typically use them.
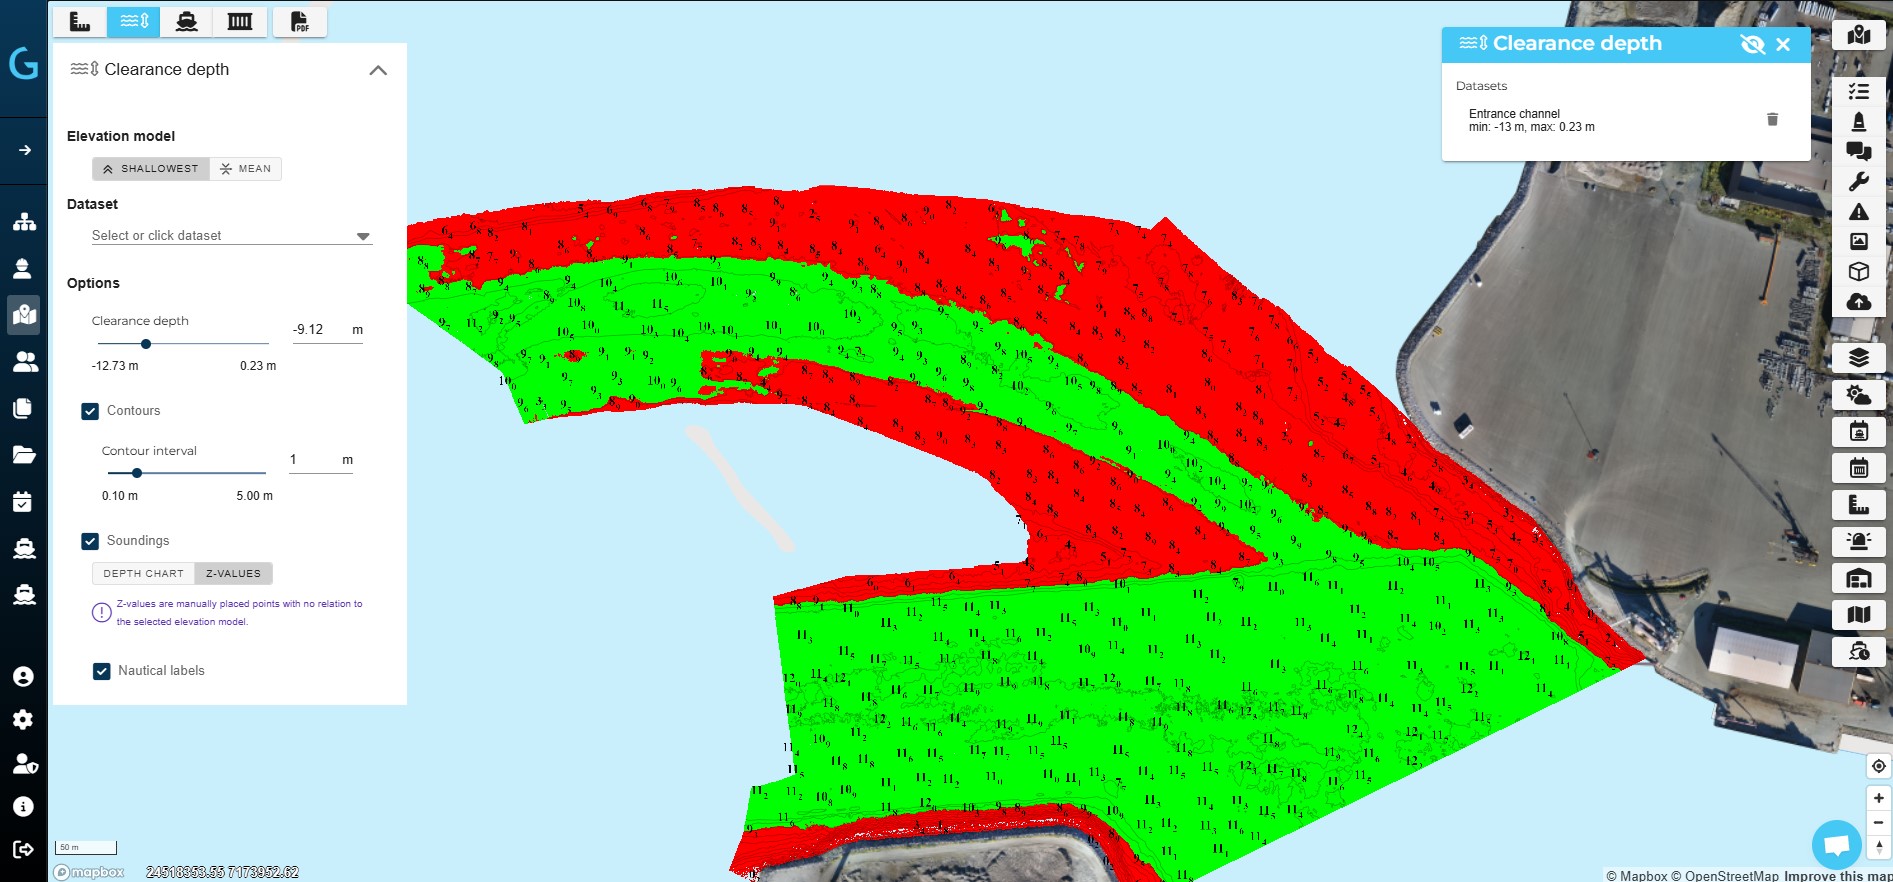
Clearance Depth Tool: “Traffic lights” for navigational depth
The Clearance Depth Tool helps users quickly identify where the seabed is too shallow relative to a chosen threshold such as a declared depth, design depth, or operational clearance requirement.
A common example: -9 m (relative to the port’s datum).
- Red = too shallow (requires attention)
- Green = deep enough (meets threshold)
Why it matters? This tool answers the most urgent operational questions fast.
- Where are the critical shallow spots today?
- Which berths or channel segments are trending toward restriction?
- What areas require dredging, monitoring, or operational controls?
It’s especially valuable because it converts a complex surface into a simple, defensible operational view: safe vs. not safe with the threshold explicitly defined.
Where ports get the most value?
- Routine survey reviews (weekly/monthly/quarterly)
- Rapid assessment after storms or high river flows
- Planning targeted dredging instead of broad “just in case” dredging
- Communicating risk areas to internal stakeholders without needing GIS expertise
Volume Calculation Tool: Quantifying cut and fill to a target level
Once a port knows where the seabed is above a threshold, the next question is usually how much material needs to move to achieve the required depth? GISGRO’s Volume Calculation Tool measures volumetrics, typically including cut and fill, to bring an area to a desired target level.
Why it matters? Because volume is where dredging becomes real money.
Even small differences in depth across a large area can translate into significant cost changes. Ports want to avoid under-dredging, which leaves navigational risk unresolved, and over-dredging, which can inflate cost, disrupt operations, and create compliance/contract complications
A volume tool that ports can apply consistently gives teams confidence in budget planning and scoping, defining dredge extents more precisely, and building a defensible basis for contractor discussions and verification.
Common use cases in our client ports:
- How many cubic meters must be removed to restore the berth pocket to -10.0 m?
- What is the cut volume inside this polygon?
- How does the required volume change if we target -8.5 m vs -9.0 m?
- What is the net change between two surveys?
The below video shows how GISGRO bathymetric tools, volume calculation and print map tool work in practice.
2D & 3D Comparison Tools: Seeing change clearly before and after dredging
Bathymetry is rarely static. But without clear comparisons, change can be misunderstood or missed entirely. GISGRO includes comparison tools in both 2D and 3D that allow users to compare surveys against each other, for example pre dredge versus post dredge, annual trends, post storm versus baseline, or contractor as left surfaces versus port verification surveys.
Comparisons enable ports answering questions like:
- What changed, and where?
- Did we achieve the design depth everywhere?
- Are we seeing re-sedimentation faster than expected?
- Is the trend stable, improving, or deteriorating?
2D views are often ideal for quick reporting and broad communication. 3D views are powerful for engineering interpretation, stakeholder engagement, and understanding complex areas like bends, berth corners, or transition zones.
Where ports get the most value?
- Post-dredge acceptance and documentation
- Contractor performance discussions
- Early warnings on repeat shoaling zones
- Long-term maintenance planning and “why here?” investigations
2D & 3D Cross Section Tools: The clearest way to explain a complex change
When a chart or surface is too broad, cross sections tell the story. GISGRO’s cross section tool allows users to generate 2D and 3D cross sections from a single dataset (to understand current profile vs expected) or multiple datasets at once (to show change across time).
Cross sections are often the most compelling evidence for:
- How a channel profile has migrated
- Whether a berth pocket has “humped up” in the center
- Where slopes are changing (and potentially affecting stability or safety)
- Whether dredging achieved the required profile—not just a spot depth
They also help answer one of the most valuable questions for any port engineering or maintenance team:
Is the seabed changing in a way that suggests a recurring root cause?
Cross sections can reveal patterns that a single “red/green map” can’t—especially in areas shaped by currents, prop wash, river outflow, or sediment transport.
A real-life experience from Port of Blyth
Ports can gain great benefits from using the bathymetric tools. But don’t trust us, trust the port using it!
“We use the dredging tools within GISGRO regularly to help maintain our safe channel depths and to support both maintenance and capital works planning.
The integration with bathymetric overlays allows us to accurately plan dredge campaigns, estimate material volumes, and issue clear, detailed instructions to our dredge contractor.
The ability to simulate under keel clearances across tidal ranges, along with accurate vessel overlays, is particularly valuable when planning berth operations, ensuring safety throughout a vessel’s stay and identifying any areas requiring levelling ahead of arrival.
The mapping functionality also enables us to share clear visual overlays with vessel operators and managers, providing added reassurance when operating within the Port.”
Ed Dick, Harbour Master, Port of Blyth
Check the video below to see how GISGRO’s comparison and cross-section tools work:
A dredging analysis workflow ports can repeat (and trust)
A practical way many ports use these tools together looks like this:
- Load the latest MBES dataset and confirm you’re working in the correct datum/reference.
- Run the Clearance Depth Tool at your operational threshold (e.g., -8.5 m) to identify shallow areas.
- Define the area of interest (polygon around the shoal/channel/berth pocket).
- Use the Volume Calculation Tool to compute required cut (and fill if relevant) to the target depth.
- Compare surveys in 2D/3D to validate change drivers, confirm dredge outcomes, or quantify re-sedimentation.
- Generate cross sections to communicate the story clearly to operations, leadership, contractors, or regulators.
- Repeat consistently on the next survey cycle to build a reliable trend record.
This repeatable workflow is what turns survey data into a management capability instead of a one-off technical exercise.
The bigger picture: better dredging decisions, better port resilience
Dredging will always be expensive. But the uncertainty around dredging doesn’t have to be.
When ports can consistently identify shallow risk areas, quantify required volumes, compare change over time, and communicate seabed evolution clearly, they unlock benefits well beyond a single project.
- More targeted dredging scopes (less “blanket dredging”)
- Better forecast and justification for budgets
- Faster internal alignment across teams
- Stronger contractor oversight and verification
- Clearer audit trails and reporting
- Earlier detection of problematic shoaling trends
Perhaps most importantly: ports start to treat bathymetry as a living operational dataset, something that informs decisions continuously, rather than a file that gets opened only when there’s a problem.
Closing thought
Ports depend on depths even more than cities depend on roads: it’s foundational infrastructure—mostly invisible until it fails. GISGRO’s dredging and volume analysis tools help ports move from reactive dredging decisions to proactive, data-driven planning—whether you’re maintaining a declared depth every season or executing a major deepening project once a decade.
Ready to take the first step?
If you would like to see what this looks like on your own data, we can set up a short online session and a free trial workspace, then walk through a recent survey and the questions you need to answer.
Book A Demo
How Gisgro helps your work
At Gisgro, we know that each role within a port comes with its own unique challenges and requirements. Discover how Gisgro can enhance your work by exploring benefits it provides for your role—transforming complex port data into clear, actionable insights that empower you to take full control.
CEO
Harbor and Marine Operators
Land operations / Technical
Commercial
Services
GIS / CAD
IT
Finance & Accounting
View all user groups
Real people. Real support.
Whether you’re curious about how GISGRO could work for your port or you’re ready to take the next step, we’d love to hear from you. Our team is friendly, experienced, and happy to help.
Just fill out the form and we’ll get back to you soon.