Port GIS
Full port visibility with Port GIS.
Port GIS turns complex infrastructure data into a real-time, clear view, helping ports manage assets, plan smarter, and improve operational control.
Fix scattered data and take full control of your port.
Managing a port’s infrastructure often means piecing together information from paper reports, spreadsheets, and siloed systems. Important data is easily lost, maintenance planning suffers, and not every job gets done in time.
GISGRO Port GIS brings everything together – turning surveys, inspections, and operational data into a real-time, visual map of your port. No more guesswork. Just clear, connected insights to help you manage assets better, plan smarter, and ensure every action creates value.
Access clear 3D models and real-time data, monitor changes, plan berthing, and make smarter decisions. All in one affordable, scalable platform designed specifically for the demands of modern ports.
Make your port operations fully visible and manageable.

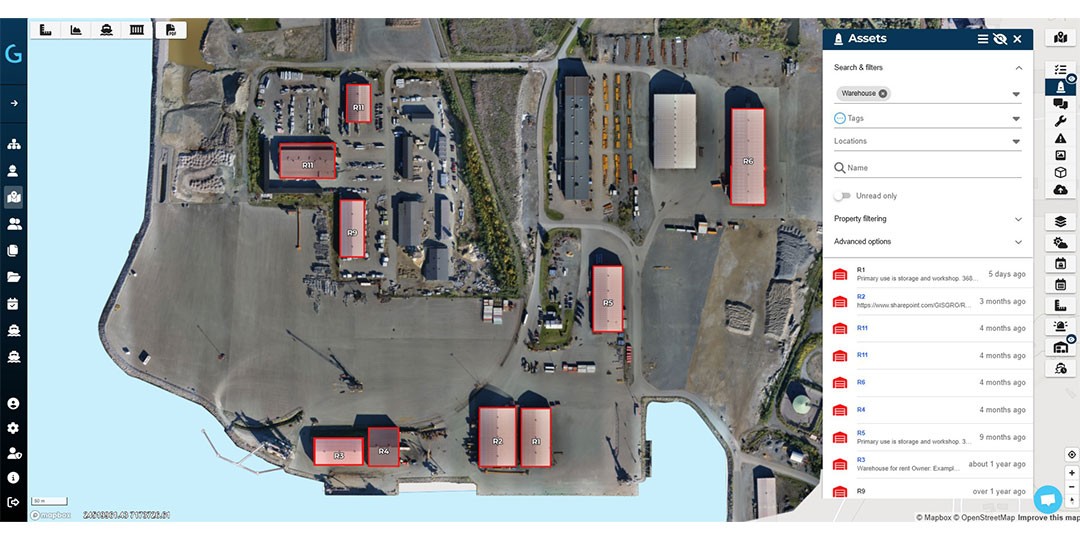
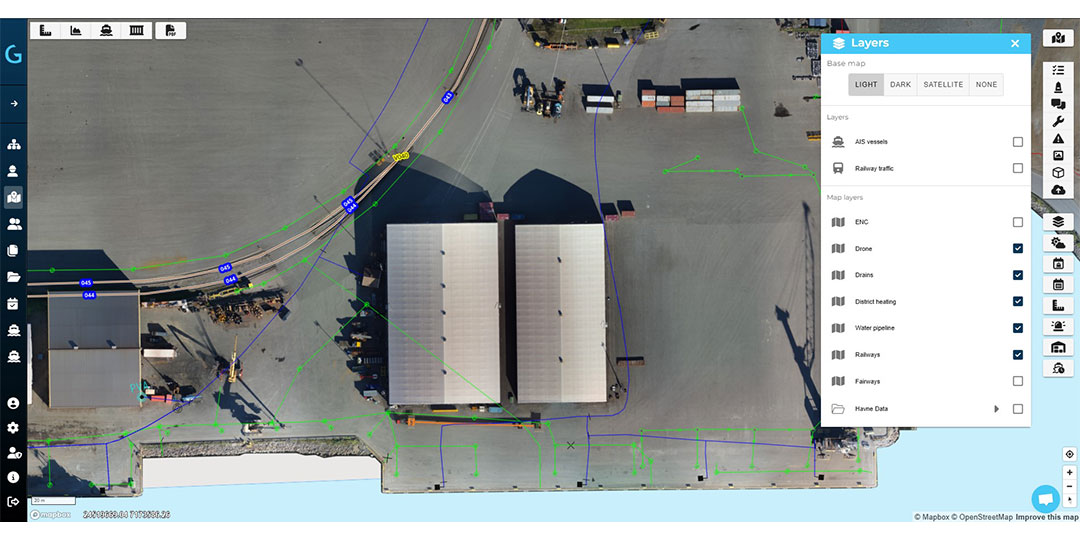
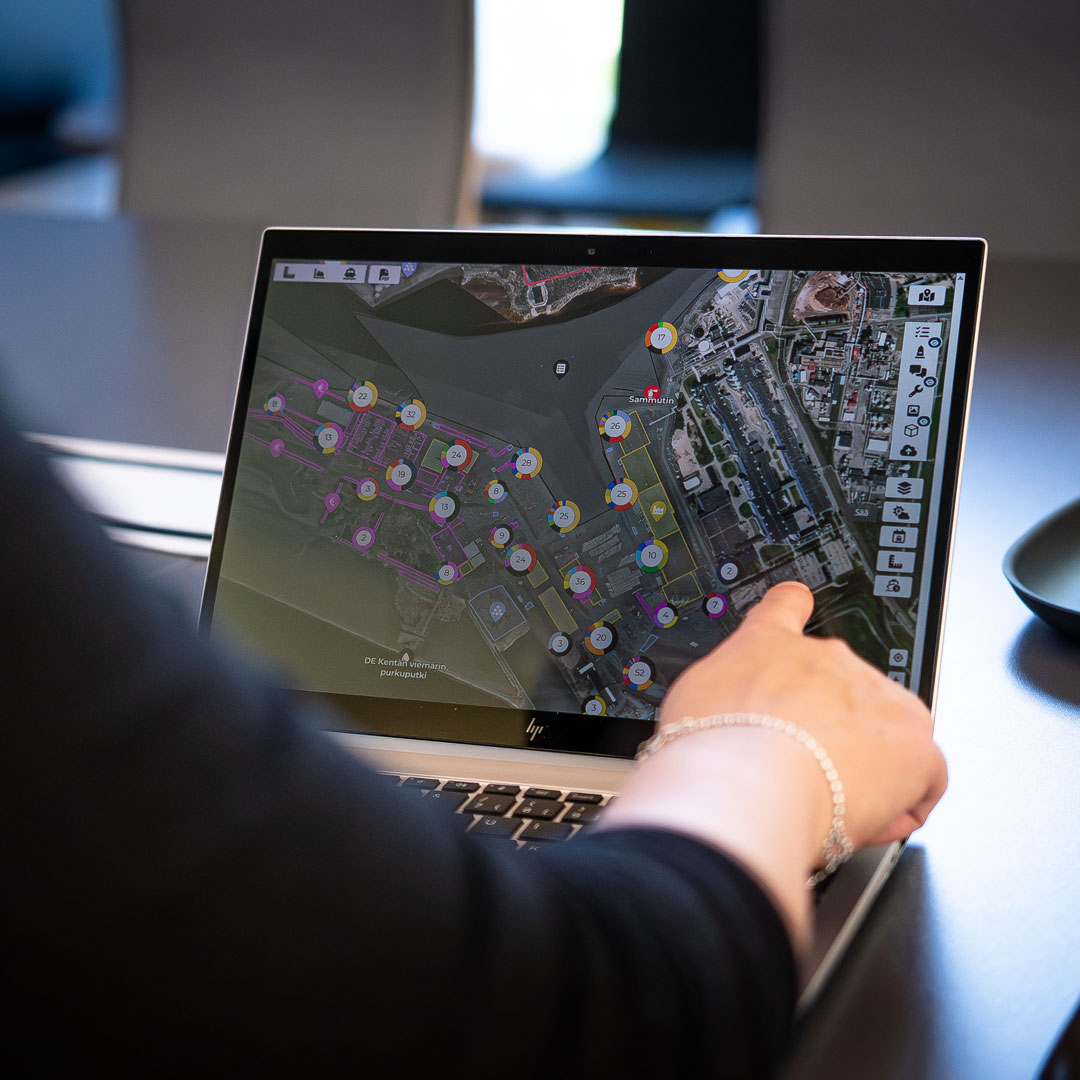
3D visualisation and GIS mapping.
Integrate survey data, high-resolution 3D models, and GIS layers to create a real-world, interactive view of port infrastructure and operations.
Centralised data management.
Combine CAD/BIM models, inspection records, sensor feeds, and operational data into a single, cloud-based platform for streamlined access and monitoring.
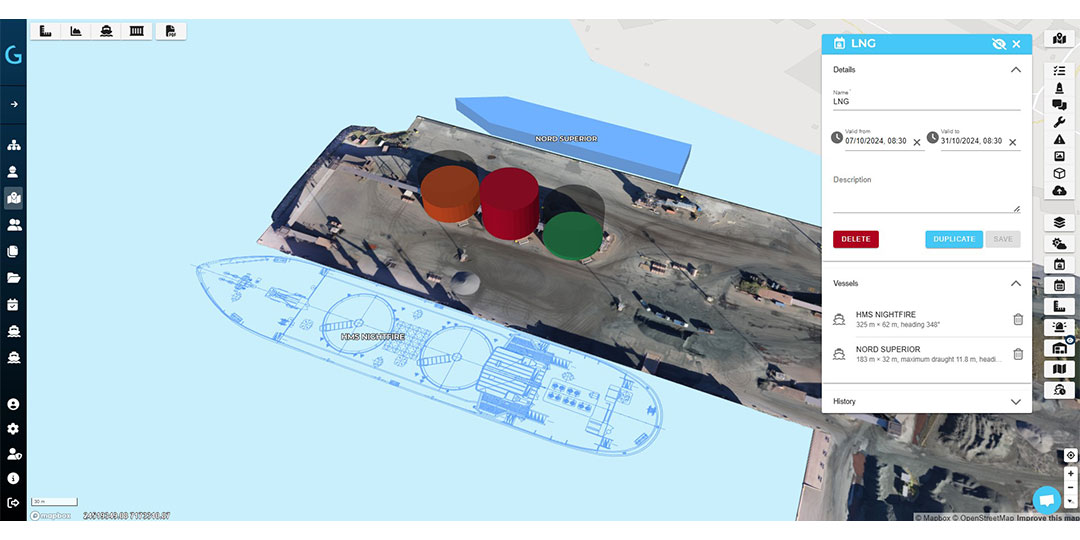
Smart asset monitoring and analysis.
Attach metadata, condition reports, and real-time updates to assets, enabling predictive maintenance planning and better decision-making through spatial analysis.
Simplify maintenance, reduce costs, and keep control of your assets.

Improve operational efficiency
Access all critical data in one place — reducing time spent searching for information and enabling faster decisions.
Strengthen maintenance planning
Monitor infrastructure condition, track changes over time, and schedule maintenance proactively to extend asset lifecycles.
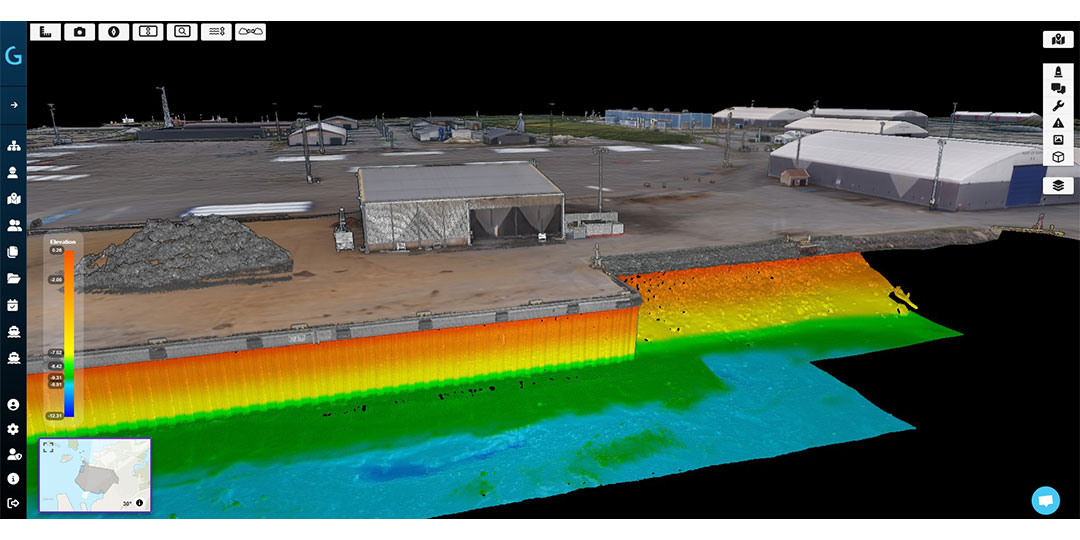
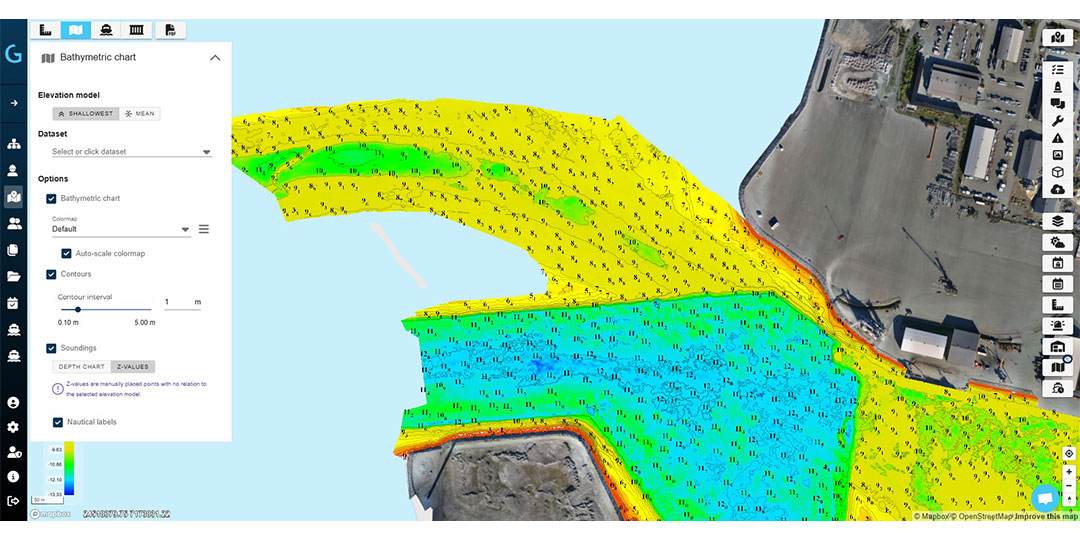
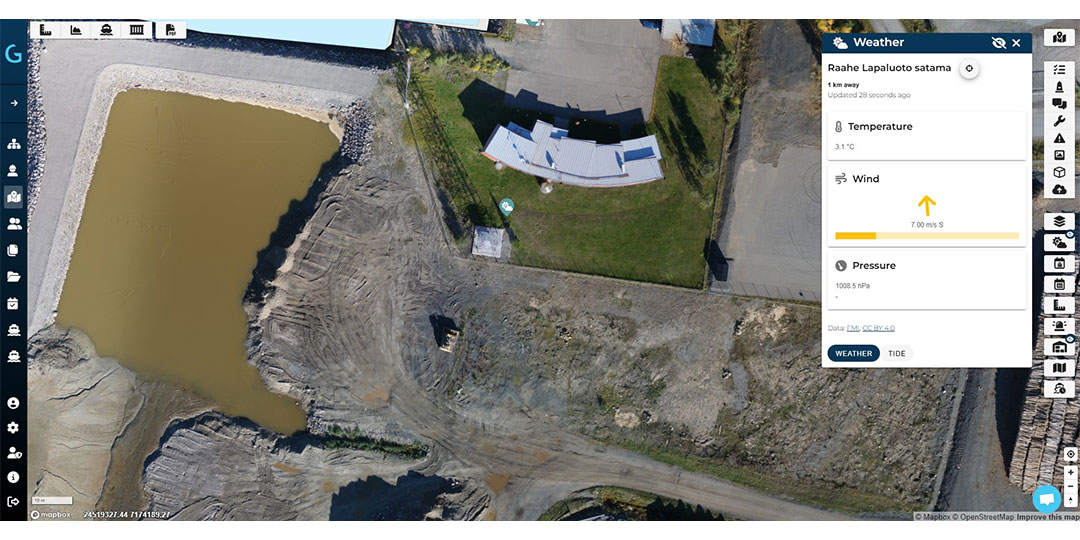
Enhance port safety and navigation
Integrate bathymetric data, navigation charts, and operational monitoring to support safer marine operations.
Make GIS easy and accessible
Empower all port teams — not just technical specialists — with an intuitive, visual platform that’s easy to use every day.
Scalable solution
Get the power of GIS without the complexity or high costs of traditional systems, with flexible scalability as your port evolves.
See Port GIS in action
As visual beings, we understand that making processes more tangible improves understanding and decision-making. With GISGRO, you have a powerful tool that helps you and your team navigate complex port operations with confidence and clarity.
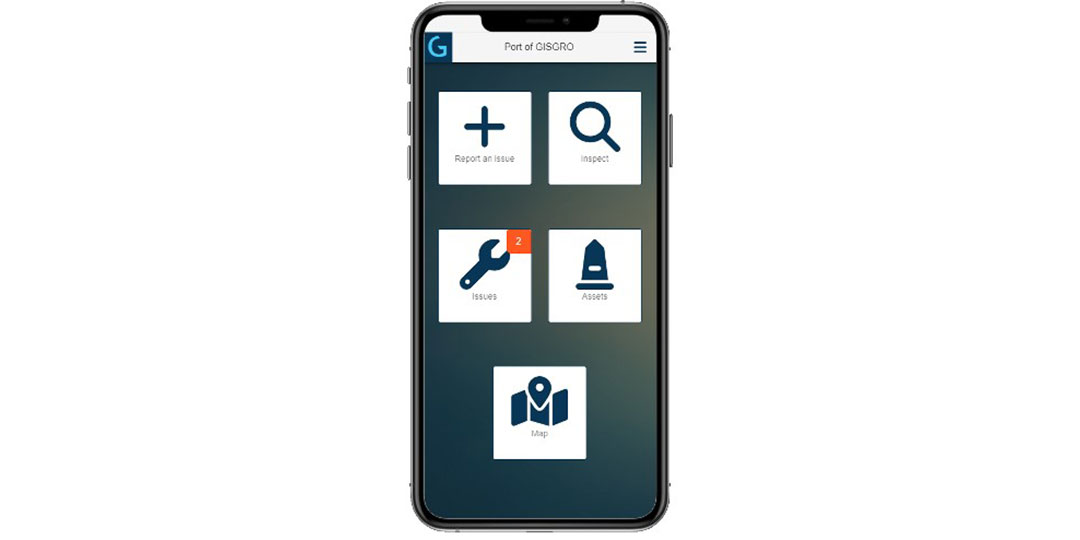
Port GIS at your service
We know that not all the modules are needed in every position in port operation. But every module has its users and for them it is really good help in every day work. From our experience, this module is especially useful for these departments.
References
Read references from some of our happy clients.

How to get started with GISGRO
Getting started with GISGRO is simple, and you’ll never be left guessing. We guide you through each step, so you can see real results, fast.
-
1.
Start with a conversation
Let’s talk about your port. We’ll show you how GISGRO works, answer your questions, and help you see what’s possible. All based on your real challenges and goals.
-
2.
Try GISGRO with your own data
We’ll set up a free trial tailored to your port, using your own data. That way, you can explore the platform in a way that’s relevant, useful, and easy to evaluate.
-
3.
Pick your modules and launch with support
You choose the features that matter. We’ll handle onboarding and training, so your team feels confident from day one, and gets real value, fast.
Deeper insights and latest headlines
Explore our Port insights hub, your one-stop destination for insightful blogs, compelling case studies, the latest news, and expert articles on port management.


Adaptable by design – build your own smart port.
Every port is different – in size, in structure, and in how far along the digital path they are. That’s why GISGRO is modular. You can start with just what you need and expand as you go. Start small or scale wide. You’re in control.
Port GIS
Port GIS turns complex infrastructure data into a real-time, clear view, helping ports manage assets, plan smarter, and improve operational control.
Vessel Traffic
Track, plan, and manage vessel movements in real time. Vessel Traffic helps ports streamline port calls, boost safety, and optimise berth usage.
Community
Community connects agents and port teams in one platform, making berth reservations and service requests faster, easier, and more accurate.
Services
Plan, track, and manage port services in one place. GISGRO Services replaces manual processes with real-time, accurate, and connected workflows.
Work Time Management
Work Time Management helps ports schedule, assign, and track shifts in one system – improving coordination, work hour tracking, and payroll accuracy.
Cargo Traffic
Cargo Traffic helps ports track handled cargo by type, volume, and timing. This ensures accurate invoicing, better reporting, and fewer errors.
Maintenance
The Maintenance module helps ports manage inspections, defects, and repairs in one system — improving safety, reducing downtime, and cutting paperwork.
Contracts
Contracts connects lease data with GIS, helping you manage estates proactively, avoid missed renewals, and get the most out of every square metre.
Invoicing
Invoicing links operational data to billing. Capture every charge, reduce admin work, and make sure no service goes unbilled.
Health & Safety
Bring safety activities into one clear system. Log incidents, manage emergency plans, and keep your port prepared with shareable, map-based tools.
Green
The GISGRO Green makes it easy to calculate and report vessel emissions using real data, helping ports support sustainability and meet compliance goals.
Real people. Real support.
Whether you’re curious about how GISGRO could work for your port or you’re ready to take the next step, we’d love to hear from you. Our team is friendly, experienced, and happy to help.
Just fill out the form and we’ll get back to you soon.